Reports & export

Spot trends, switch periods, and download CSV for your spreadsheet.

1 / 3 · next: Compare categories
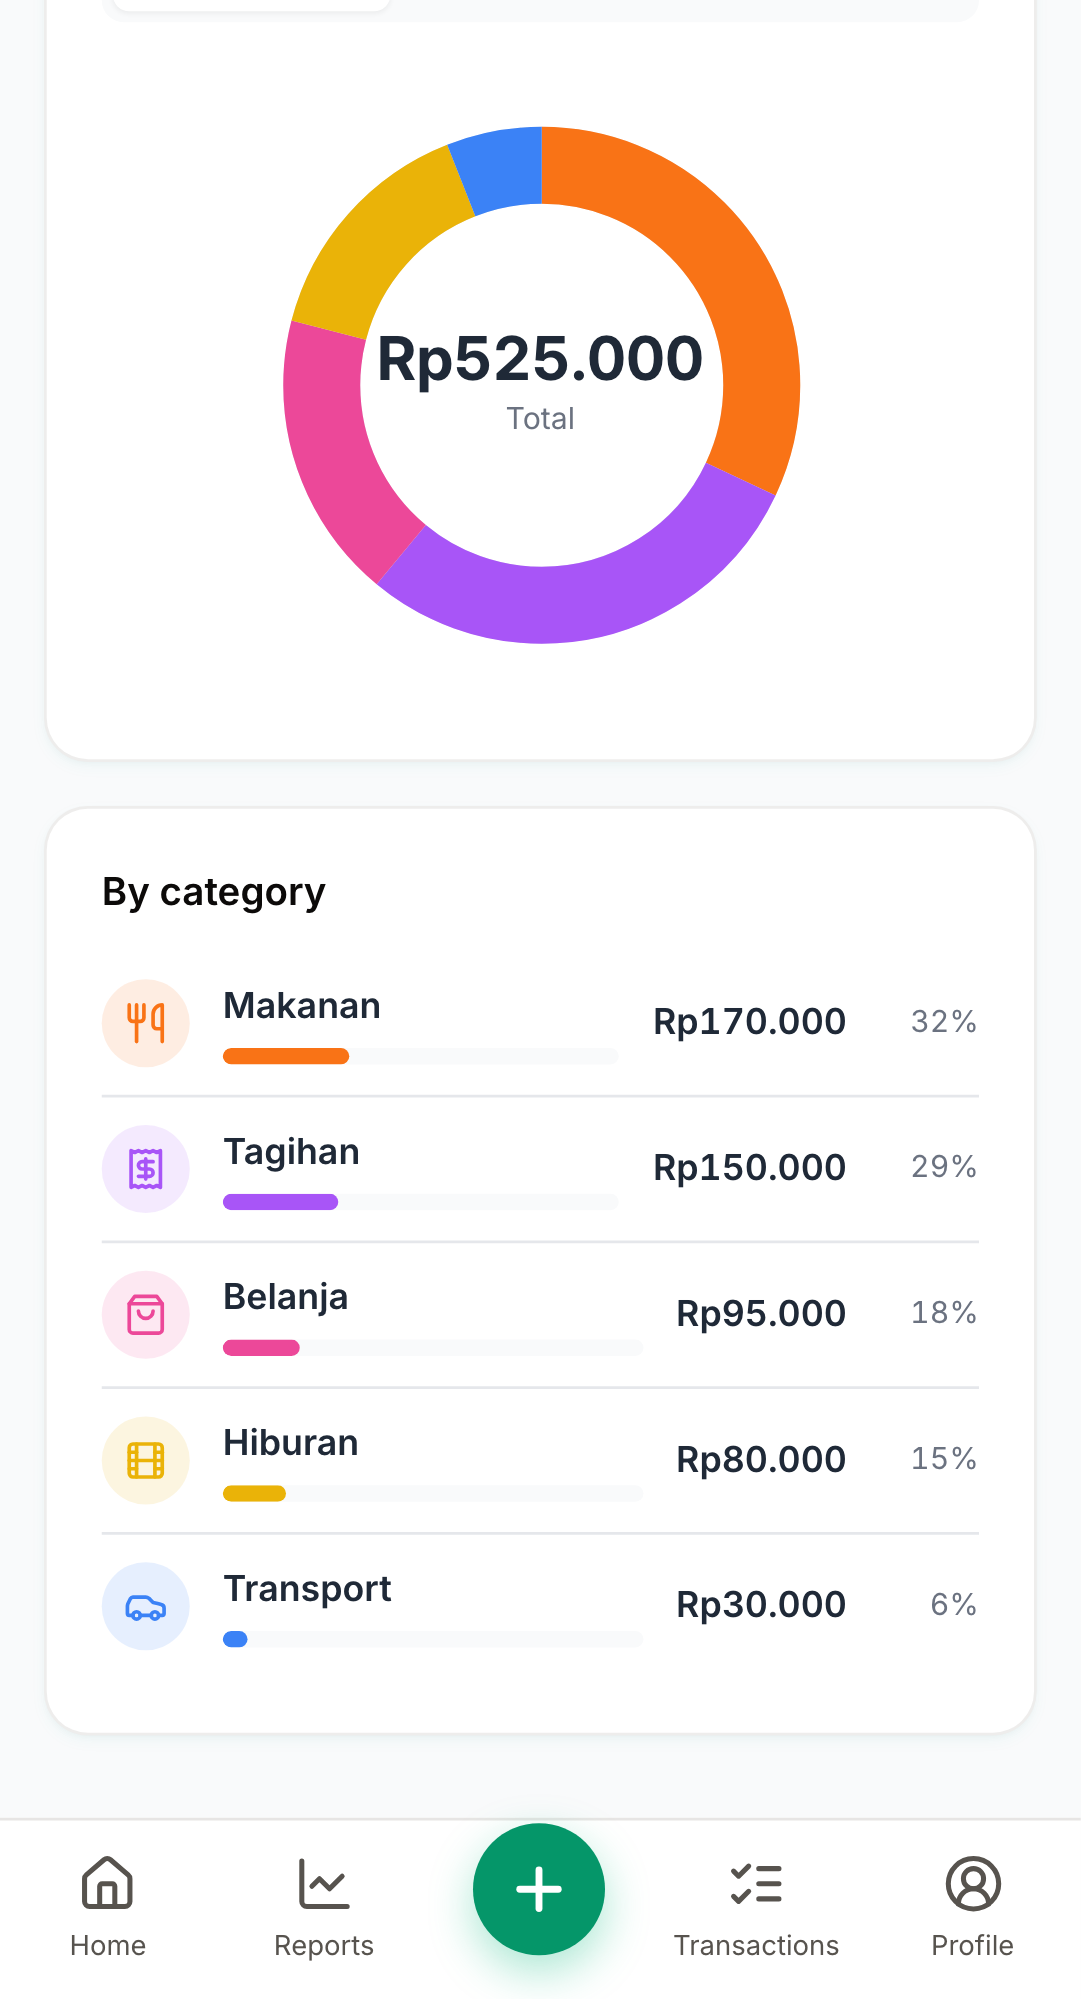
Screenshot: Pie chart of this month's spend
1

See your monthly breakdown

The Pie tab shows where your money went this month. Each slice is a category with its share and total.

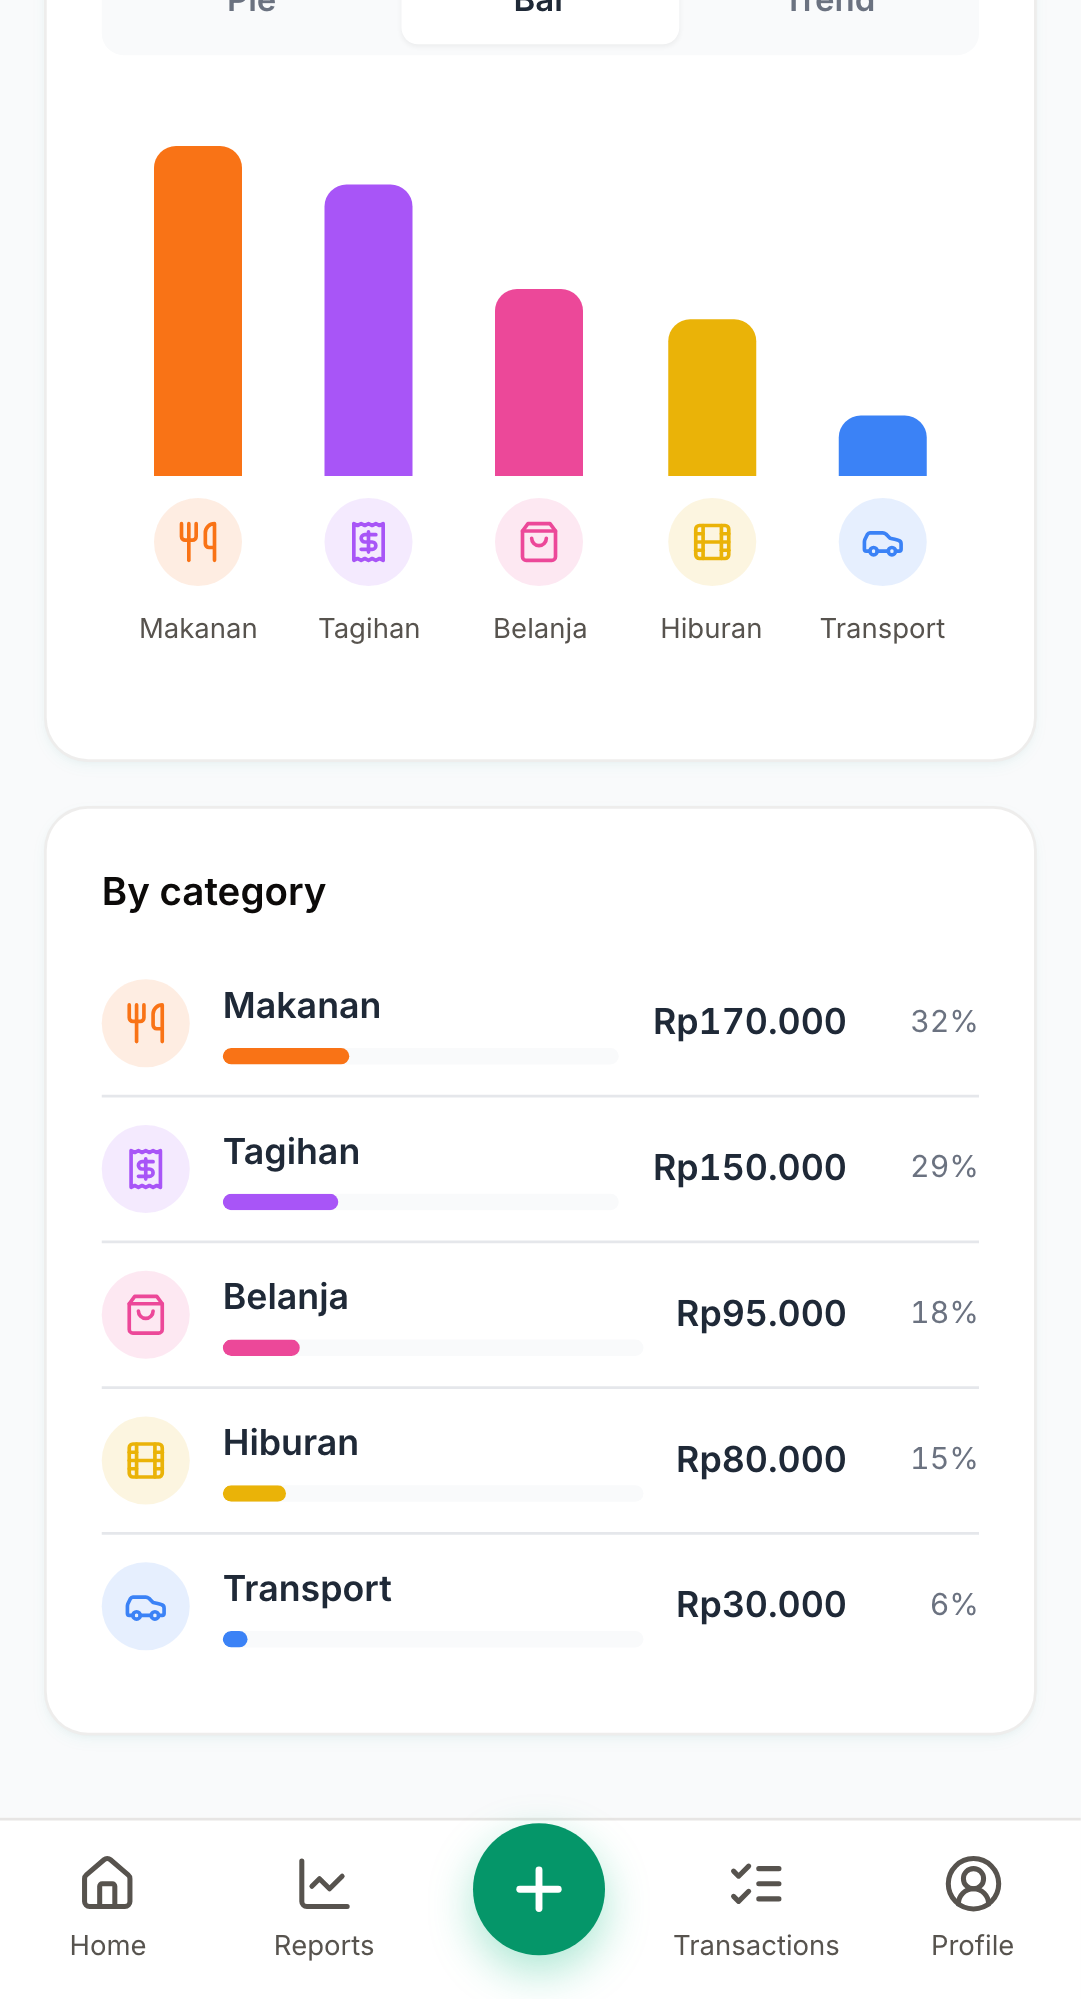
Screenshot: Bar chart ranked by spend
2

Compare categories

Switch to the Bar tab to see categories ranked side-by-side. Tap a category to filter the page.

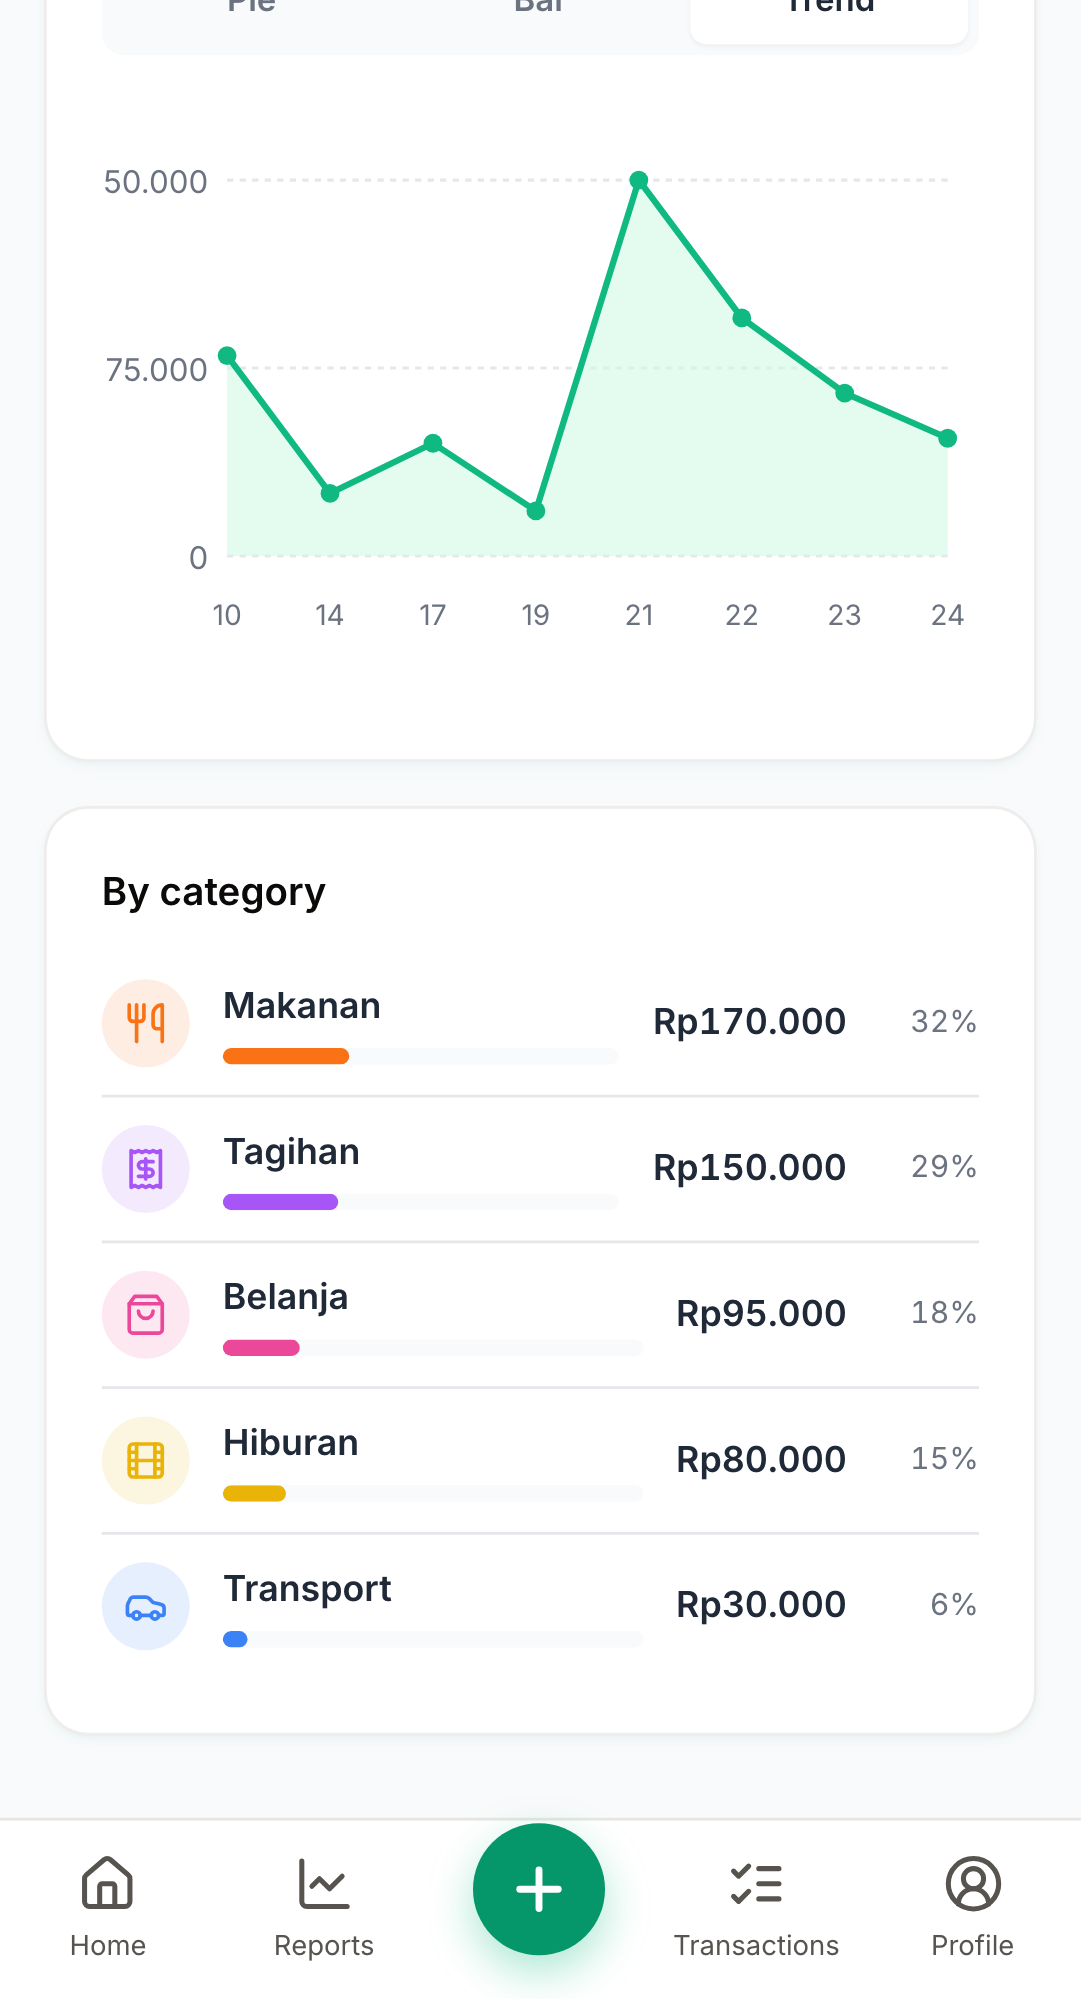
Screenshot: Trend line + download button
3

Spot the trend, then export

Switch to the Trend tab for daily spend. Tap the download icon (top-right) to export the period as CSV.

Troubleshooting

Chart is empty+

Add a few expenses first; charts need at least one transaction in the selected range.

CSV download blocked+

Allow downloads for this site in your browser settings, then tap the icon again.